
Published in Profit & Loss
Published in Profit & Loss
Published in Profit & Loss
Image credit by Unsplash
Image credit by Unsplash
Image credit by Unsplash

Aubrey Threadgill
Aubrey Threadgill
Aubrey Threadgill
Founder at Retriever
Founder at Retriever
Founder at Retriever
July 25, 2024
July 25, 2024
July 25, 2024
Everything you need to know about the QuickBooks Profit and Loss report
Everything you need to know about the QuickBooks Profit and Loss report
Everything you need to know about the QuickBooks Profit and Loss report
Learn how to create, customize, and analyze the P&L
Learn how to create, customize, and analyze the P&L
Learn how to create, customize, and analyze the P&L
Introduction
One of the core features of QuickBooks Online is the Profit and Loss (P&L) report, which provides a view of a business's financial health for a particular period. In this post, I'll show you how I create, customize, and analyze my P&L report in QuickBooks Online.
Understanding Profit and Loss Reports
A Profit and Loss report, also known as an Income Statement, summarizes revenues, costs, and expenses over a specific period. This report is essential for understanding a business's profitability and making informed financial decisions.
Setting Up QuickBooks Online
Before diving into report creation, ensure your QuickBooks Online account is properly set up:
Chart of Accounts: Make sure it's organized for accurate reporting.
Financial Data: Keep your data up-to-date and categorized correctly.
Creating a Profit and Loss Report in QuickBooks Online
To generate my P&L report, I follow these steps:
Step 1: Log in to your QuickBooks Online account.
Step 2: Navigate to the “Reports” section from the dashboard.
Step 3: Search for “Profit and Loss” in the report search bar.

Step 4: Select the desired date range for the report (e.g., This Year-to-date, This month, etc.)
Step 5: Customize the report settings, such as cash vs. accrual basis, and columns to display. The configurations include:

(1) Report period. This sets the time range for my report.
(2) Display columns by. This determines the columns for my report. Columns can be date intervals (e.g. months) or other dimensions, such as customers, vendors, employees, classes, or products/services.
(3) Show non-zero or active only. Per QuickBooks, this allows me to "declutter the report" by hiding empty rows or columns. I can also hide rows and columns whose values are zero.
(4) Compare another period. This generates columns that provide a reference point, helping me evaluate relative performance. Options include previous period (e.g. last month), previous year (e.g. the same month a year prior), year-to-date, % of row, % of column, % of income, and % of expense.
(5) Accounting method. Switch between Cash or Accrual accounting. By choosing Cash, this will include only money paid or received. Choosing Accrual will include open invoices and bills.
Step 6: Remember to click “Run report” and voila, I now have my customized Profit And Loss report.
Analyzing the Profit and Loss Report
Now that I've created my P&L, I want to further analyze it to evaluate the health of my business so that I can plan ahead and think strategically about my business.
Export to a spreadsheet
To begin analyzing my report, I prefer to export the report to a spreadsheet like Google Sheets (or Excel). You can export the report by clicking here:
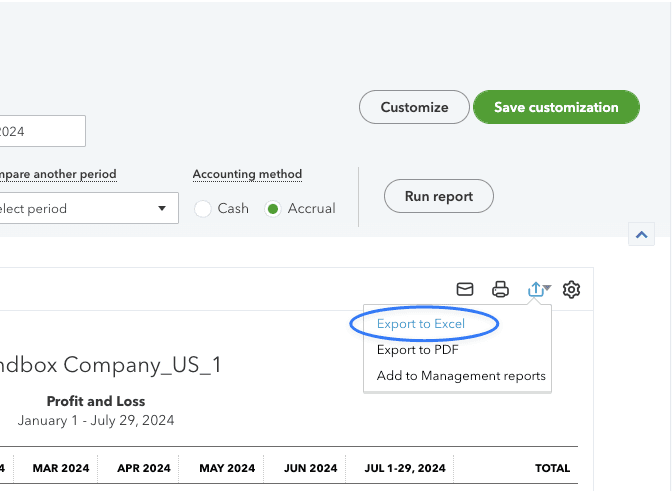
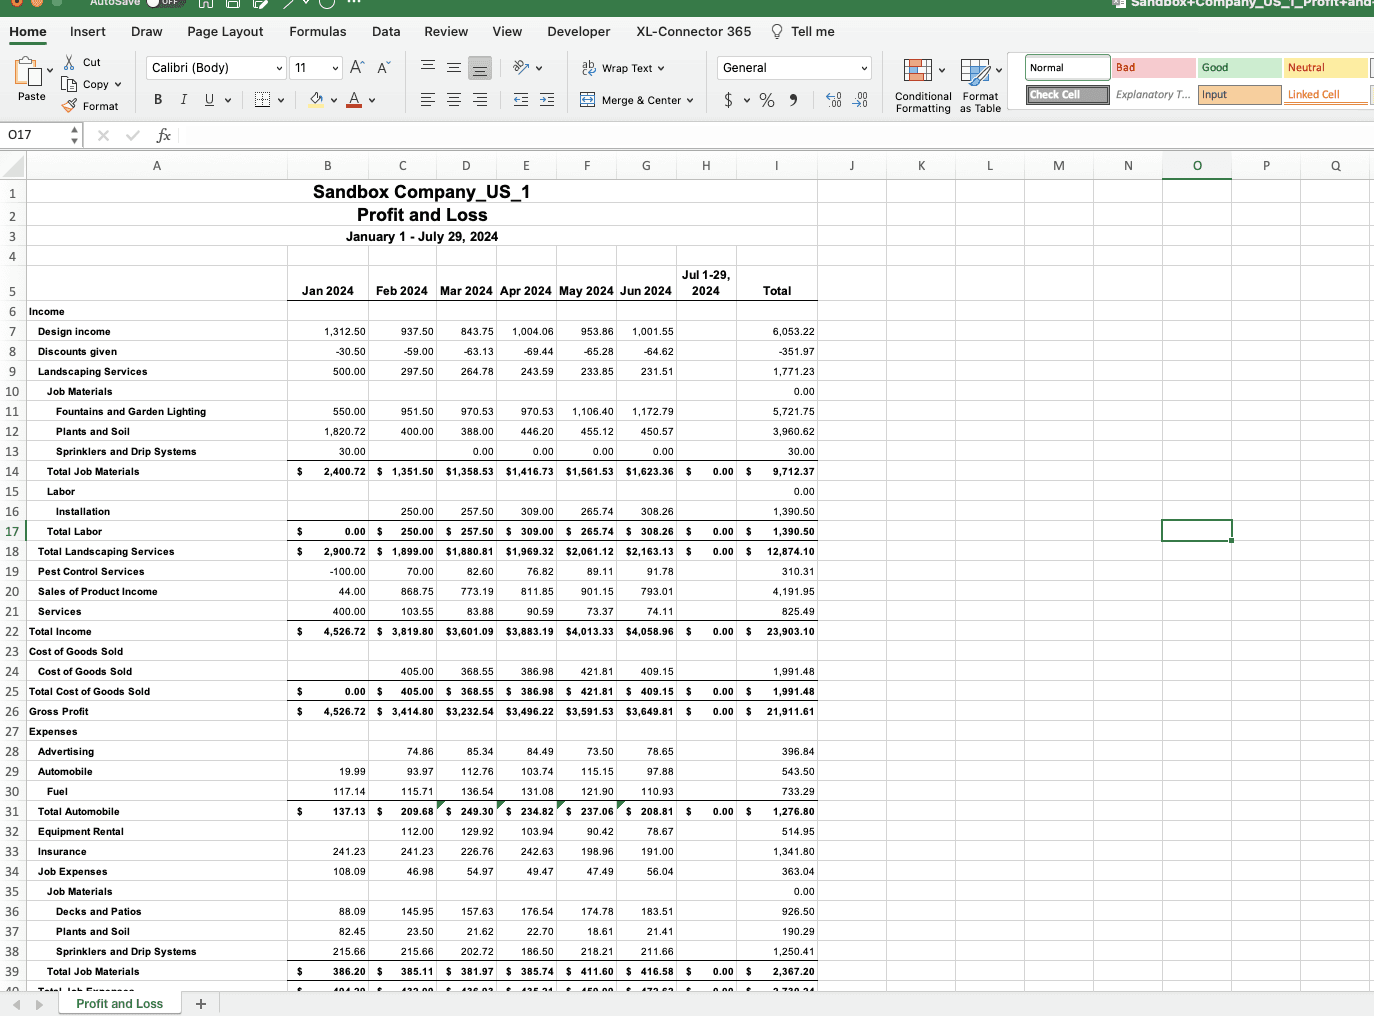
Now open the 'Downloads' folder on your computer, open the report, and this is what we should see.
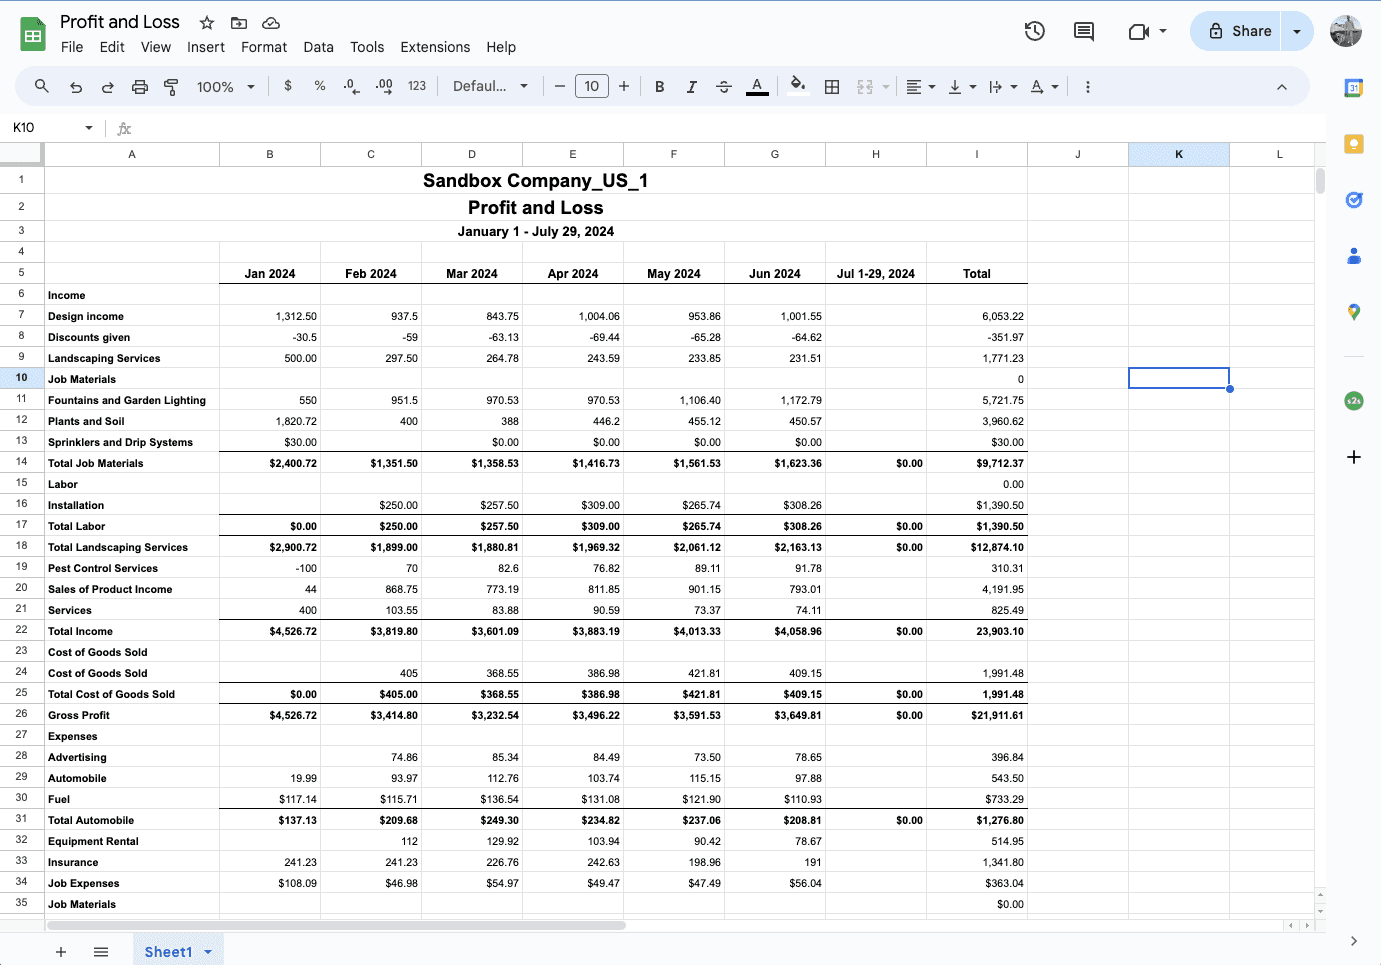
(Optional Step: Paste into Google Sheets)
Next, I open a new Google Sheet (tip: simply type sheet.new in the URL bar to create a new Google Sheet). Then I paste in the values. I prefer Google Sheets because of its sharing features that make it easy to collaborate with my coworkers and clients.
Format the P&L report
At this point, I take the step of formatting the report. Here's why I choose to format my reports:
Readability. There are a few subtle tweaks –– removing bolding from non-total rows, adding alternating colors to rows, removing decimal points, hiding gridlines –– that help my eyes more easily scan the report and focus in on what matters.
Flexibility. The standard QuickBooks report comes with merged cells. These merged cells can make it difficult to add new columns or create dynamic cell references, so I take the step of unmerging them.
Confidence. While changing the font of my report won't increase my profit, it will increase the confidence of the reader. By taking just a few extra minutes to improve the presentation of my reports, it demonstrates to the reader that I've taken an extra degree of care in preparing the financials.
If you would like to use my template, you are more than welcome to copy it here:
Profit And Loss - Retriever

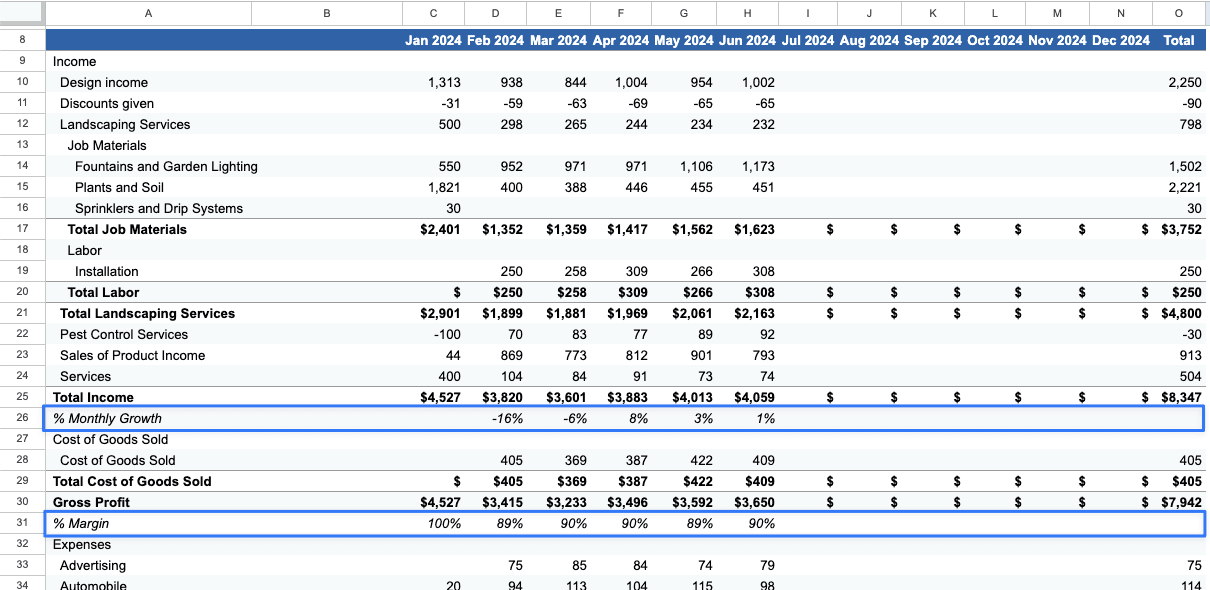
Incorporate Analysis
Finally, it's time to incorporate my analysis. Here are a couple of go-to calculations for every P&L report.
Revenue Trends: Identify monthly growth in my income, so I can understand how the business is performing at a high level.
Profit Margins: Calculate my gross and net profit margins, so I can measure how a dollar of revenue translates into profit at the per-unit level and to my bottom line.
Insert visualizations
Inserting charts is the best way for me to identify potentially weaknesses in my business. It's also highlights areas of my business that are performing well and that I should double down on. Lastly, charts help me detect anomalies in my business, like unusual expenses or uncollected receivables that I need to go chase.

Automating Profit and Loss Reports
As you can see, generating Profit and Loss reports in QuickBooks is fairly straightforward. That being said, it can become tedious logging into QuickBooks, navigating to the reports, generating a report, exporting it to Excel, pasting it into Google Sheets, and –– worst of all –– redoing your analysis and charts each month.
I built Retriever to solve this frustration. Retriever is a Google Sheets extension that allows you to connect unlimited QuickBooks companies, create reports, and auto-refresh them with the latest QuickBooks data every hour.
The best part is that you can add new rows & columns or charts for your analysis, and they won't get overwritten or break the report. Simply trigger a refresh or enable auto-refresh, and Retriever will fetch the latest financials in insert them into their correct cell location.
I hope you'll give it a try or leave me feedback for ways I can help remove the tedium from your finance and accounting processes!

Download the free template and try Retriever for free
Download our free P&L report template: Profit And Loss - Retriever [Google Sheets]
Start your free trial (no credit card required): Retriever for QuickBooks [Google Workspace]
Request a demo or personalized assistance: Book a Demo [gRetriever.com]
Thanks for reading!
Aubrey
Introduction
One of the core features of QuickBooks Online is the Profit and Loss (P&L) report, which provides a view of a business's financial health for a particular period. In this post, I'll show you how I create, customize, and analyze my P&L report in QuickBooks Online.
Understanding Profit and Loss Reports
A Profit and Loss report, also known as an Income Statement, summarizes revenues, costs, and expenses over a specific period. This report is essential for understanding a business's profitability and making informed financial decisions.
Setting Up QuickBooks Online
Before diving into report creation, ensure your QuickBooks Online account is properly set up:
Chart of Accounts: Make sure it's organized for accurate reporting.
Financial Data: Keep your data up-to-date and categorized correctly.
Creating a Profit and Loss Report in QuickBooks Online
To generate my P&L report, I follow these steps:
Step 1: Log in to your QuickBooks Online account.
Step 2: Navigate to the “Reports” section from the dashboard.
Step 3: Search for “Profit and Loss” in the report search bar.
Step 4: Select the desired date range for the report (e.g., This Year-to-date, This month, etc.)
Step 5: Customize the report settings, such as cash vs. accrual basis, and columns to display. The configurations include:
(1) Report period. This sets the time range for my report.
(2) Display columns by. This determines the columns for my report. Columns can be date intervals (e.g. months) or other dimensions, such as customers, vendors, employees, classes, or products/services.
(3) Show non-zero or active only. Per QuickBooks, this allows me to "declutter the report" by hiding empty rows or columns. I can also hide rows and columns whose values are zero.
(4) Compare another period. This generates columns that provide a reference point, helping me evaluate relative performance. Options include previous period (e.g. last month), previous year (e.g. the same month a year prior), year-to-date, % of row, % of column, % of income, and % of expense.
(5) Accounting method. Switch between Cash or Accrual accounting. By choosing Cash, this will include only money paid or received. Choosing Accrual will include open invoices and bills.
Step 6: Remember to click “Run report” and voila, I now have my customized Profit And Loss report.
Analyzing the Profit and Loss Report
Now that I've created my P&L, I want to further analyze it to evaluate the health of my business so that I can plan ahead and think strategically about my business.
Export to a spreadsheet
To begin analyzing my report, I prefer to export the report to a spreadsheet like Google Sheets (or Excel). You can export the report by clicking here:
Now open the 'Downloads' folder on your computer, open the report, and this is what we should see.
(Optional Step: Paste into Google Sheets)
Next, I open a new Google Sheet (tip: simply type sheet.new in the URL bar to create a new Google Sheet). Then I paste in the values. I prefer Google Sheets because of its sharing features that make it easy to collaborate with my coworkers and clients.
Format the P&L report
At this point, I take the step of formatting the report. Here's why I choose to format my reports:
Readability. There are a few subtle tweaks –– removing bolding from non-total rows, adding alternating colors to rows, removing decimal points, hiding gridlines –– that help my eyes more easily scan the report and focus in on what matters.
Flexibility. The standard QuickBooks report comes with merged cells. These merged cells can make it difficult to add new columns or create dynamic cell references, so I take the step of unmerging them.
Confidence. While changing the font of my report won't increase my profit, it will increase the confidence of the reader. By taking just a few extra minutes to improve the presentation of my reports, it demonstrates to the reader that I've taken an extra degree of care in preparing the financials.
If you would like to use my template, you are more than welcome to copy it here:
Profit And Loss - Retriever
Incorporate Analysis
Finally, it's time to incorporate my analysis. Here are a couple of go-to calculations for every P&L report.
Revenue Trends: Identify monthly growth in my income, so I can understand how the business is performing at a high level.
Profit Margins: Calculate my gross and net profit margins, so I can measure how a dollar of revenue translates into profit at the per-unit level and to my bottom line.
Insert visualizations
Inserting charts is the best way for me to identify potentially weaknesses in my business. It's also highlights areas of my business that are performing well and that I should double down on. Lastly, charts help me detect anomalies in my business, like unusual expenses or uncollected receivables that I need to go chase.
Automating Profit and Loss Reports
As you can see, generating Profit and Loss reports in QuickBooks is fairly straightforward. That being said, it can become tedious logging into QuickBooks, navigating to the reports, generating a report, exporting it to Excel, pasting it into Google Sheets, and –– worst of all –– redoing your analysis and charts each month.
I built Retriever to solve this frustration. Retriever is a Google Sheets extension that allows you to connect unlimited QuickBooks companies, create reports, and auto-refresh them with the latest QuickBooks data every hour.
The best part is that you can add new rows & columns or charts for your analysis, and they won't get overwritten or break the report. Simply trigger a refresh or enable auto-refresh, and Retriever will fetch the latest financials in insert them into their correct cell location.
I hope you'll give it a try or leave me feedback for ways I can help remove the tedium from your finance and accounting processes!
Download the free template and try Retriever for free
Download our free P&L report template: Profit And Loss - Retriever [Google Sheets]
Start your free trial (no credit card required): Retriever for QuickBooks [Google Workspace]
Request a demo or personalized assistance: Book a Demo [gRetriever.com]
Thanks for reading!
Aubrey

Continue Reading
Continue Reading
Continue Reading